

Updated November 2026.
AWS Cost Explorer is the free reporting tool inside AWS Billing and Cost Management. It charts cost and usage over time, lets you filter and group by service, account, Region, tag and usage type, forecasts future spend, and recommends Savings Plans and Reserved Instance purchases. For most teams it is the first place to answer “why did the bill go up?”
It changed more in the last year than in the five before. Forecasts now reach 18 months, and an Amazon Q button explains cost changes in plain language. It still has hard limits, though, and knowing them stops you from arguing with a chart that was never built for your question.
Turning it on
Open the Billing and Cost Management console and choose Cost Explorer. You cannot enable it through the API. Once enabled, AWS prepares your cost data for the current month and the last 12 months and calculates a forecast; current month data shows up in about 24 hours.
In AWS Organizations, the management account sees every member account. Member accounts see their own spend unless the management account restricts it.
What Cost Explorer can show you
| Capability | What you get |
|---|---|
| History | Up to 38 months at monthly granularity, for year-over-year analysis |
| Granularity | Daily and monthly by default; hourly for the past 14 days when enabled |
| Resource-level data | Daily for all services, hourly for EC2, when enabled |
| Forecast | Up to 18 months ahead, using up to 36 months of history |
| AI explanations | “Analyze with Amazon Q” for historical, forecast and comparison views |
| Recommendations | Savings Plans and Reserved Instance purchase suggestions |
| Reports | Coverage and utilization for commitments |
Hourly and resource-level data are optional settings and carry a charge, so turn them on for the accounts where you need them rather than everywhere.
The reports worth knowing
Monthly costs by service
The default view. The top three or four services usually account for most of the bill, so start there.
Group by usage type
When a service looks too large, group it by usage type. EC2 splits into compute, EBS, data transfer, NAT gateway and public IPv4 charges; S3 splits into storage classes, requests and transfer. Most surprises live here.
Group by linked account, then by tag
Linked accounts show which team or environment owns a spike. Tags add detail once you activate them as cost allocation tags, but only from that moment onward; past spend stays unattributed. Expect up to a day before tagged data appears. Report the untagged share every month. Cloud cost allocation explains why.
Group by purchase option
Shows On-Demand, Savings Plans, Reserved and Spot spend side by side, which is the quickest way to see how much eligible usage is still uncommitted. Reserved vs Spot vs On-Demand covers what to do with that number.
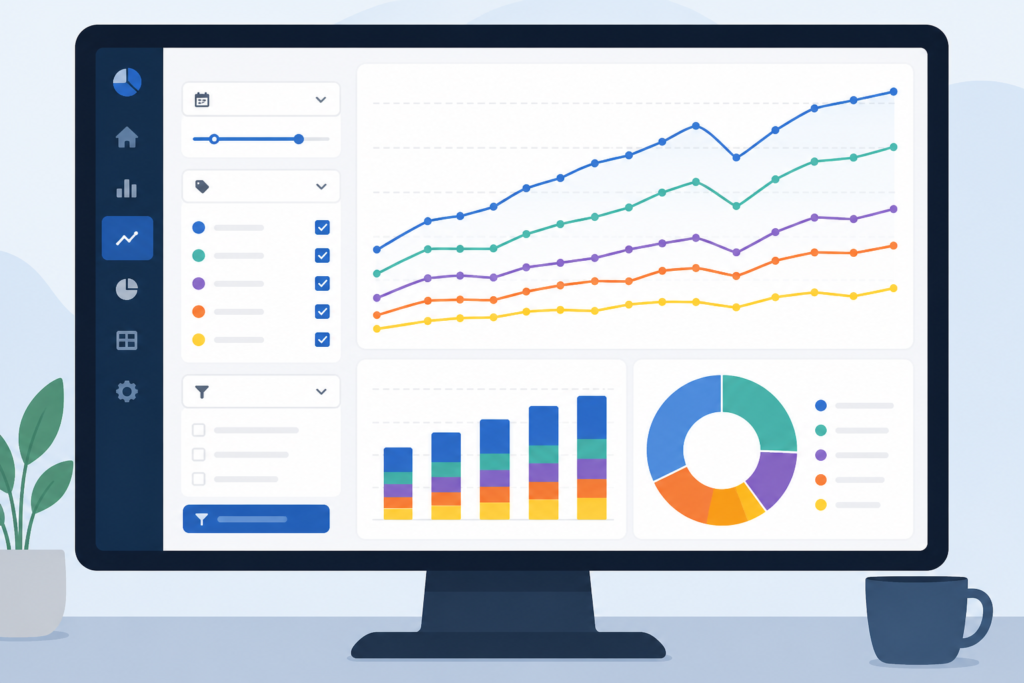
Daily view for spikes
Switch to daily granularity to tell a steady climb from a one-day spike. A step change that stays is usually a deployment; a spike that returns to baseline is usually a job or a test.
Forecasts: better, still not a budget
In November 2025, AWS extended Cost Explorer forecasts from 12 to 18 months and upgraded the models to analyze up to 36 months of history, up from six, to pick up seasonality and long-term growth. The 18-month horizon is available in the console and through the GetCostForecast API.
AWS also added AI-powered explanations of the drivers behind each forecast, initially in preview and only in the console.
Treat the forecast as a trend line. It sees your history, not your roadmap: a product launch, a migration or a new AI feature will not appear until it shows up in usage. FP&A teams should combine it with planned changes; see the FP&A process.
Analyze with Amazon Q
Since June 9, 2026, Cost Explorer has an “Analyze with Amazon Q” button that explains whatever report you are viewing. AWS says it adapts to the date range: historical explanations for past periods, forecast explanations for future ones, or both for mixed ranges. AWS’s walkthrough shows it drawing on pricing data, budgets, anomaly detection and optimization recommendations. AWS lists it at no additional cost in all commercial Regions.
It is most useful for people who do not live in billing data: an engineering manager asking why their account rose 18% in May gets a written answer with the top drivers and their share of the change. Check the numbers it cites against the chart before you forward them; it explains, it does not audit.
Commitment recommendations
Cost Explorer recommends Savings Plans and Reserved Instances based on past usage, with projected savings. That is also its weakness: a workload you plan to retire next month still looks worth committing to. Before buying:
- Check the lookback period the recommendation uses, and compare it with planned changes.
- Recalculate after cleanup and rightsizing; see the cloud cost optimization checklist.
- Read Reserved Instances versus Savings Plans.
- After buying, watch utilization and coverage reports monthly.
What it costs
The console is free. The Cost Explorer API charges per request ($0.01 per paginated request on the AWS pricing page at the time of writing), which is trivial for a weekly report and noticeable for a dashboard that polls constantly. Hourly and resource-level granularity are billed separately. Check the pricing page for current rates.
| Need | Console | API |
|---|---|---|
| Ad hoc investigation | Best fit | Not ideal |
| Scheduled reports | Saved reports, CSV export | Scripts or dashboards |
| Feed a BI or FinOps tool | Not possible | Possible, per-request cost |
| Detailed line items | Not possible | Use Data Exports instead |
Where it stops being enough
Not real time. Cost data lags by hours. To catch a runaway job, use AWS Budgets alerts and Cost Anomaly Detection.
No split container costs. AWS split cost allocation data for EKS and ECS, which divides instance cost by pod or task, appears in the Cost and Usage Report, not in Cost Explorer. Kubernetes cost monitoring covers the alternatives.
Limited shared cost logic. Cost Categories and split charge rules help, but complex allocation and per-customer unit costs push you toward Data Exports (CUR 2.0 or FOCUS 1.2) queried with Athena or a FinOps platform.
One cloud only. For AWS plus Azure or Google Cloud, see multi-cloud cost management.

A first-hour routine
- Open Monthly costs by service and note the top four services.
- Group the biggest by usage type and look for data transfer, NAT, IPv4 and log charges.
- Group by linked account, then by tag, and write down the share with no owner.
- Group by purchase option to see uncommitted eligible usage.
- Click “Analyze with Amazon Q” on last month’s report and compare its drivers with your own reading.
- Check commitment coverage and utilization.
- Set a budget and anomaly alert so the next spike reaches you before the invoice.
Then work through the findings with how to reduce your AWS bill, and estimate changes with the AWS cost calculator.
Questions people ask
Is AWS Cost Explorer free?
The console is free. API requests carry a small per-request charge, and optional hourly and resource-level data are billed.
How far ahead does Cost Explorer forecast?
Up to 18 months, since November 2025, using up to 36 months of history.
Why do my tags not show up?
Tags must be activated as cost allocation tags, and only spend after activation carries them. Allow up to a day.
Can Cost Explorer show Kubernetes costs per namespace?
Not directly. Split cost allocation data for EKS is available in the Cost and Usage Report, not in Cost Explorer.
Sources
- AWS Cost Explorer features (AWS)
- AWS Cost Explorer overview (AWS)
- Cost Explorer 18-month forecasting and AI explanations (AWS, November 2025)
- Introducing 18-month forecasting and explainable AI insights (AWS Cloud Financial Management blog)
- Cost Explorer intelligent cost explanations with Amazon Q (AWS, June 2026)
- Introducing intelligent cost explanations in Cost Explorer (AWS blog)
- Enabling split cost allocation data (AWS docs)
- AWS Cost Explorer pricing

Pingback: RDS Cost Optimization: Where Amazon RDS Spend Hides
Pingback: Cloud Cost Optimization Checklist: 40 Checks for 2026
Pingback: S3 Cost Optimization: Storage Classes, Lifecycle and Fees