

Last updated: September 10, 2026
This post delivers a detailed and up-to-date snapshot of FinOps statistics for 2026. You’ll find adoption rates, cost waste benchmarks, AI spend management data, governance trends, team structure insights, and market size projections—all backed by the latest industry research.
How prevalent is FinOps today?
FinOps adoption continues to accelerate. In 2026, 63 % of organizations have a dedicated FinOps team—a rise from 51 % in 2024—marking the fastest two-year growth rate recorded in the discipline so far. ([stats.conversationalgeek.com](https://stats.conversationalgeek.com/blog/finops-statistics-2026?utm_source=openai))
Cloud spend management remains the top organizational challenge, cited by 85 % of respondents, maintaining its lead over security for a fourth consecutive year. ([stats.conversationalgeek.com](https://stats.conversationalgeek.com/blog/finops-statistics-2026?utm_source=openai))
How big is the FinOps market?
The global FinOps services market is valued at approximately US$15.77 billion in 2026. It is projected to grow at a 9.56 % compound annual growth rate (CAGR), reaching roughly US$24.9 billion by 2031. ([axis-intelligence.com](https://axis-intelligence.com/finops-statistics/?utm_source=openai))
What share of cloud spend is wasted?
Cloud waste—defined as portions of IaaS/PaaS spend that deliver no business value—climbed to 29 % in 2026, reversing a five-year downward trend. ([axis-intelligence.com](https://axis-intelligence.com/finops-statistics/?utm_source=openai))
However, organizations with mature FinOps governance (full governance) reduce effective waste to about 10.4 %, compared to 29 % in companies without FinOps governance—a gap of 18.6 percentage points. ([axis-intelligence.com](https://axis-intelligence.com/finops-statistics/?utm_source=openai))
How many FinOps teams now manage AI costs?
AI spend has exploded onto the FinOps radar: In 2026, 98 % of FinOps practitioners manage AI-related costs—up from 63 % in 2025 and just 31 % in 2024. ([finopsllm.com](https://finopsllm.com/research/state-of-finops-2026-ai-spend?utm_source=openai))
Where do FinOps teams report?
Reporting lines reveal growing technical influence: 78 % of FinOps teams now report to the CTO or CIO, up from around 60 % previously, while only 8 % report into finance (CFO). ([axis-intelligence.com](https://axis-intelligence.com/finops-statistics/?utm_source=openai))
How are FinOps teams structured?
The average core team size for organizations with US$100 million+ in cloud spend is around 8–10 full-time practitioners plus 3–10 contractors. ([axis-intelligence.com](https://axis-intelligence.com/finops-statistics/?utm_source=openai))
A federated (hub-and-spoke) enablement model is becoming prevalent, allowing embedded champions and automation to scale FinOps without commensurate headcount growth. ([data.finops.org](https://data.finops.org/?utm_source=openai))
What other technology spend areas do FinOps teams manage?
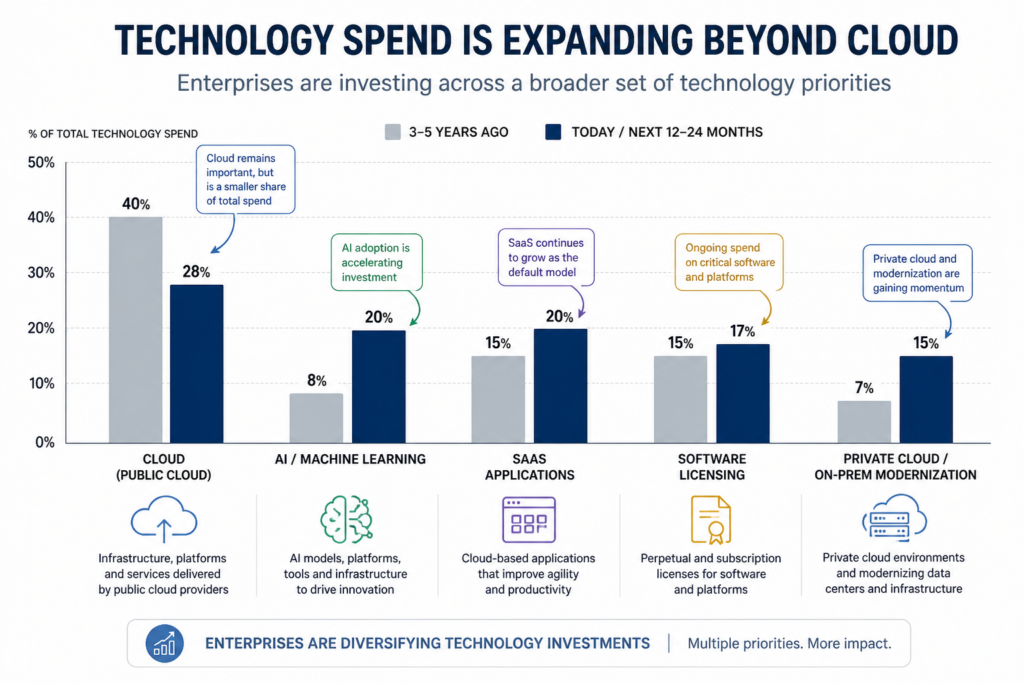
| Technology Spend Area | 2026 – % Managing | 2025 – % Managing | Year-over-Year Change |
|---|---|---|---|
| AI | 98 % | 63 % | +35 pp |
| SaaS | 90 % | 65 % | +25 pp |
| Licensing | 64 % | 49 % | +15 pp |
| Private Cloud | 57 % | 39 % | +18 pp |
| Data Center | 48 % | 36 % | +12 pp |
| Labor Costs (emerging) | 28 % | — | New |
FinOps has clearly expanded beyond public cloud into adjacent domains where spend is less predictable and tooling is immature. ([data.finops.org](https://data.finops.org/?utm_source=openai))
Which metrics are FinOps teams tracking?
- 64 % measure progress by “value delivered to business units,” up 12 percentage points year-over-year. ([info.flexera.com](https://info.flexera.com/CM-REPORT-State-of-the-Cloud?utm_source=openai))
- Cost efficiency/savings remains a top metric, cited by approximately 81 % of organizations. ([stats.conversationalgeek.com](https://stats.conversationalgeek.com/blog/finops-statistics-2026?utm_source=openai))
- Tracking cost per service (unit economics) jumped to 49 %, up 9 percentage points from 2025. Enterprise organizations lead at 53 % versus 32 % for SMBs. ([stats.conversationalgeek.com](https://stats.conversationalgeek.com/blog/finops-statistics-2026?utm_source=openai))
How many organizations operate a Cloud Center of Excellence (CCoE)?
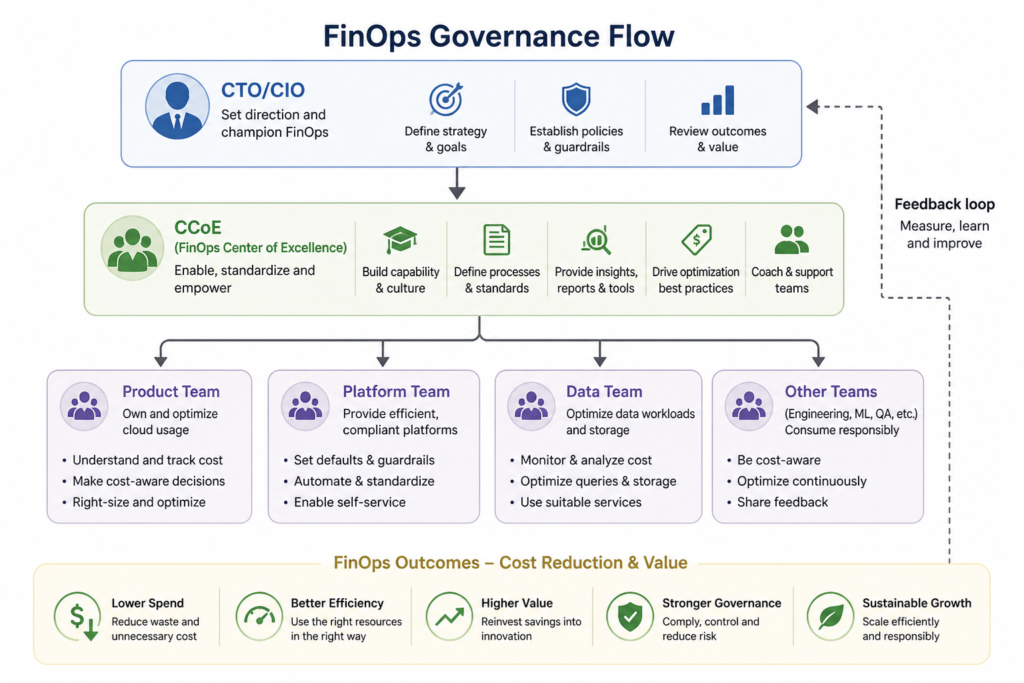
71 % of organizations have a Cloud Center of Excellence, fostering stronger collaboration between FinOps, business units, and Software Asset Management (SAM) teams. ([info.flexera.com](https://info.flexera.com/CM-REPORT-State-of-the-Cloud?utm_source=openai))
Key Comparisons at a Glance
| Metric | 2024 | 2025 | 2026 |
|---|---|---|---|
| FinOps team prevalence | 51 % | 59 % | 63 % |
| AI spend management | 31 % | 63 % | 98 % |
| Cloud waste estimated | ~27 % | ~27 % | 29 % |
| Teams reporting to CTO/CIO | ~60 % | — | 78 % |
Why These Statistics Matter
- FinOps is becoming mainstream: With 63 % adoption and near-universal AI cost coverage, FinOps is now core to technology financial management.
- Governance drives results: Fully governed organizations cut cloud waste from nearly 29 % to about 10 %.
- Value alignment leads adoption: Tracking value and unit economics is replacing pure cost avoidance as key metrics.
- Scope is expanding: FinOps now spans SaaS, licensing, private infrastructure—and even labor.
- Centralization improves maturity: CCoEs and CTO/CIO alignment are shaping effective FinOps teams.
These numbers provide a clear benchmark for teams evaluating their FinOps maturity in 2026. Whether you’re scaling AI costs, building governance, or shifting towards value-centric metrics, these stats show where your peers are—and where FinOps is headed.
See also: What is FinOps? for foundational context and definitions.