

Updated November 21, 2026, with Q3 2026 market data. Each figure names its source and date.
Cloud cost statistics for 2026 come down to one tension. The market is growing faster than at any point in almost a decade, pulled by AI, while the share of spend that customers believe they waste has started rising again. Bigger bills, and more of them leaking.
This page collects the numbers we could trace to a named source, groups them by the question you are probably trying to answer, and says what each figure leaves out. For data on FinOps teams and practices, see our FinOps statistics page.
How big is the cloud market?
Synergy Research Group, now part of TechInsights, tracks quarterly spending on cloud infrastructure services (IaaS, PaaS and hosted private cloud).
| Quarter | Spending | Year-over-year growth |
|---|---|---|
| Q2 2026 | about $143 billion | 43% |
| Q3 2026 | $167.7 billion | 55% |
Trailing twelve-month revenue reached $558 billion by the end of September 2026. Synergy said the market had doubled in eight quarters, and that growth accelerated for the twelfth quarter in a row.
Gartner measures a wider market that includes SaaS. Its September 2025 forecast expected public cloud services growth of 21.3% in 2026, with the market heading for $1.48 trillion by 2029. Its August 2026 data put worldwide IaaS spending at $287 billion in 2026, up 29.3%.
The two firms count different things, so do not mix their totals in one chart. Synergy is closer to “what companies pay AWS, Azure, Google and peers for infrastructure”; Gartner adds application software sold as a service.
Who gets the money
Synergy’s Q3 2026 shares of cloud infrastructure services:
| Provider | Share, Q3 2026 |
|---|---|
| Amazon (AWS) | 26% |
| Microsoft | 19% |
| 16% | |
| Everyone else | 39% |
In the same quarter, reported revenue growth was 39% at AWS, 48% at Microsoft Azure and 103% at Google Cloud, according to TelecomTV’s summary of results. Tier-two growth was led by Oracle and neoclouds such as CoreWeave, Crusoe and Nebius.
For cost teams, the practical point is that more organizations now pay several providers at once. Managing several bills at once is the topic of multi-cloud cost management.
How much of the market is AI?
About a third. Synergy estimated that AI-specific cloud services accounted for roughly one third of the total market in Q3 2026.
Gartner’s August 2026 forecast is narrower and more precise:
| Segment | 2025 | 2026 | 2027 |
|---|---|---|---|
| AI-optimized IaaS | $21.5 billion | $42.3 billion (+96%) | $66.1 billion (+57%) |
| Total IaaS | $222.2 billion | $287.3 billion (+29%) | $359.9 billion (+25%) |
Gartner expects inference to drive much of this, with inference-focused AI infrastructure spending growing 55% in 2026. Inference bills recur every day a product is live, which makes them a FinOps for AI problem more than a one-off training budget. See cost per token for the unit that matters.
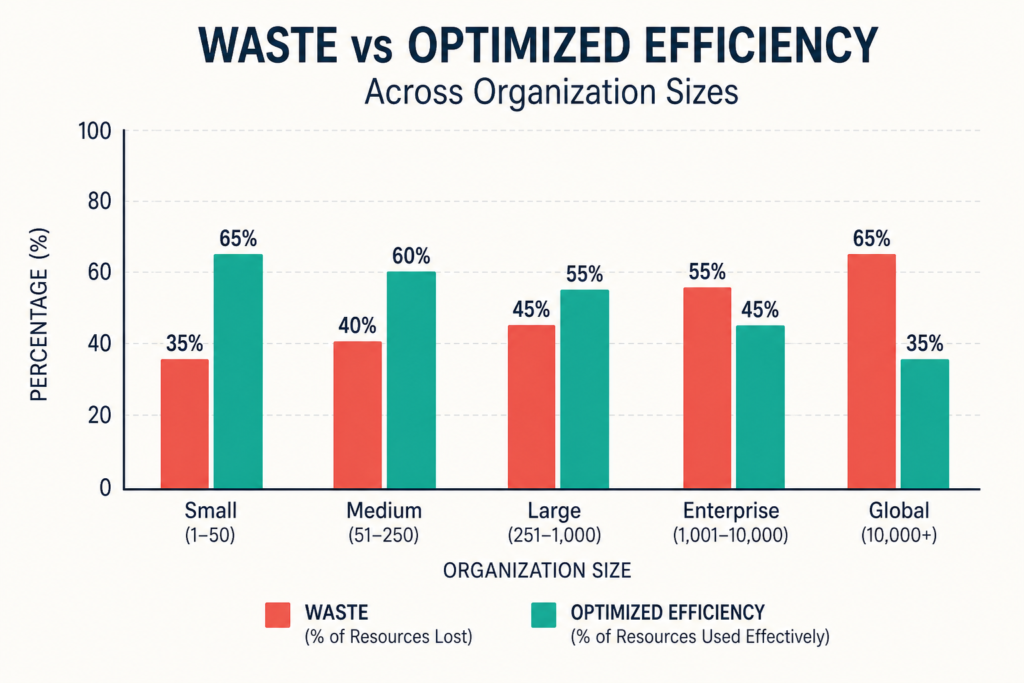
Ảnh gốc của bài: Chart of cloud waste estimates and efficiency benchmarks for 2026
How much cloud spend is wasted?
Flexera’s State of the Cloud 2026, published in March and based on 753 respondents (62% in the U.S.), estimates that 29% of IaaS and PaaS spend is wasted. That is up from 27% in 2024 and 2025, and it reverses a five-year decline from about 30% in 2021.
Flexera links the rise to AI workloads and new PaaS and SaaS offerings that add cost complexity. Two cautions apply. The figure is a self-estimate by respondents, not an audit of invoices. And it describes the average respondent, so your own waste could be 8% or 45%.
Where AWS bills actually leak
Survey estimates are fuzzy. Billing data is sharper. Datadog’s State of Cloud Costs report, published in June 2024, analyzed AWS cost data from hundreds of its customers. The figures are older than the rest on this page but still the best public look inside real bills:
| Finding | Figure |
|---|---|
| Share of container costs going to idle resources | 83% (54% cluster idle, 29% workload idle) |
| Organizations still running previous-generation EC2 | 83% (about 17% of their EC2 budget) |
| Share of EBS spend still on older gp2 volumes | 58%, although gp3 costs about 20% less |
| Organizations paying cross-AZ data transfer | 98%, about half of all data transfer cost |
| Organizations using commitment discounts | 67%, but only 29% covered more than half of eligible spend |
| GPU instances as a share of EC2 compute among adopters | 14%, up from 10% |
| Arm (Graviton) share of EC2 compute among adopters | 18%, double the year before |
Several of these map directly to fixes. Idle container capacity is a Kubernetes cost monitoring job. Old instance generations and Intel-only fleets are rightsizing and Graviton work. Low commitment coverage is covered in Reserved vs Spot vs On-Demand. Old gp2 volumes are one of the easiest wins in S3 and storage cost optimization.
How efficient are companies, really?
Two efficiency measures point in different directions, which is useful in itself.
AWS publishes a State of Cost Efficiency report that scores customers on rightsizing, idle cleanup and commitment use. It reported a median Cost Efficiency score of 83 and a mean of 79 as of May 2026. A median above the mean means a minority of customers score very badly and drag the average down.
CloudZero’s February 2026 survey of 475 senior leaders measured efficiency against revenue instead. Its mean Cloud Efficiency Rate fell from 80% to 65% in a year, and the bottom quartile fell from 70% to 45%. In plain terms, cloud and AI costs grew faster than revenue for most of the companies surveyed, even as 72% ran formal cost programs, up from 39%.
So companies are getting better at hygiene (AWS’s measure) while losing ground on unit economics (CloudZero’s). Better hygiene cannot fix a product whose cost per customer rises with every new AI feature. That is why cost per customer belongs next to the waste report.
Ảnh gốc của bài: Visual summary of cloud cost benchmarks and how to apply them
The wider spending picture
Gartner forecasts worldwide IT spending of $6.15 trillion in 2026, up 10.8%. Data center systems spending is set to rise 31.7% to more than $650 billion, and server spending 36.9%, mostly from AI infrastructure. Much of that hardware ends up rented back to customers as cloud capacity, which is where cloud bills begin.
Statistics to treat with suspicion
Some numbers appear on dozens of sites without a source. We left these out:
- “Companies waste 30% to 50% of cloud spend.” No survey with a method behind it that we could find.
- “94% of enterprises use cloud.” Usually a recycled figure from an old survey, quoted without its year.
- “Cloud saves 30% versus on-premises.” Depends entirely on the workload; no general study supports one number.
If a statistic has no named survey, sample size and year, it is folklore.
How to use these numbers
Benchmarks justify a review. They do not set targets.
- Use the market growth figures to explain why your bill rose even when usage looked flat: providers are adding higher-priced AI services fast, and your teams are using them.
- Use the waste and leak tables as a checklist. Each row points to a specific report you can run in your own account.
- Track one revenue-based measure alongside hygiene metrics, such as cost per customer or cost as a share of revenue.
- Start with the cloud cost optimization checklist and the order of work in how to reduce your AWS bill.
Questions people ask
How much do companies spend on cloud each year?
Synergy put trailing twelve-month cloud infrastructure services revenue at $558 billion as of Q3 2026. Gartner’s broader public cloud figure, including SaaS, is higher.
What percentage of cloud spend is wasted?
Flexera’s 2026 respondents estimate 29% of IaaS and PaaS spend.
Which cloud provider is biggest?
AWS, with a 26% share of cloud infrastructure services in Q3 2026, ahead of Microsoft at 19% and Google at 16%, according to Synergy.
How fast is AI cloud spending growing?
Gartner expects AI-optimized IaaS spending to grow 96% in 2026 to about $42 billion, and Synergy estimates AI-specific services now make up about a third of the cloud market.
Sources
- Cloud Infrastructure Services Market, Q3 2026 Update (TechInsights, Synergy Research Group)
- Cloud revenue hits $168B as AI capacity expands (Data Center Knowledge)
- AI drives cloud services sector growth to 55% in Q3 (TelecomTV)
- Cloud infrastructure spending hit an eight-year high in Q2 2026 (ITPro)
- Gartner forecast: public cloud services, 3Q25 update
- Gartner forecasts AI-optimized IaaS spending to grow 96% in 2026
- Gartner forecasts worldwide IT spending of $6.15 trillion in 2026
- Cloud cost management trends from five years of State of the Cloud (Flexera)
- State of Cloud Costs 2024 (Datadog)
- The AWS State of Cost Efficiency report
- FinOps in the AI Era press release (CloudZero)


Pingback: FinOps Statistics 2026: Adoption, Scope, Teams