

Last updated: September 12, 2026
Cloud cost statistics in 2026 show global cloud spending in the hundreds of billions, waste rates of 25–35%, and efficiency gains from FinOps and automation. This article compiles the most recent data and benchmarks to help IT and DevOps teams ground their cost strategies in real numbers.
How much are organizations spending on cloud in 2025–2026?
Public cloud spending reached approximately $723 billion in 2025, with projections exceeding $840 billion in 2026 ([wring.co](https://www.wring.co/blog/cloud-cost-statistics-2026?utm_source=openai)). Other forecasts suggest hyperscalers’ AI-related expenditures alone may see a 27% rise in 2026, potentially pushing overall infrastructure investment even higher ([techradar.com](https://www.techradar.com/pro/cloud-spending-soars-as-hyperscalers-up-ai-investment-and-could-reach-a-landmark-high-in-2026?utm_source=openai)).
How much of that spend is wasted?
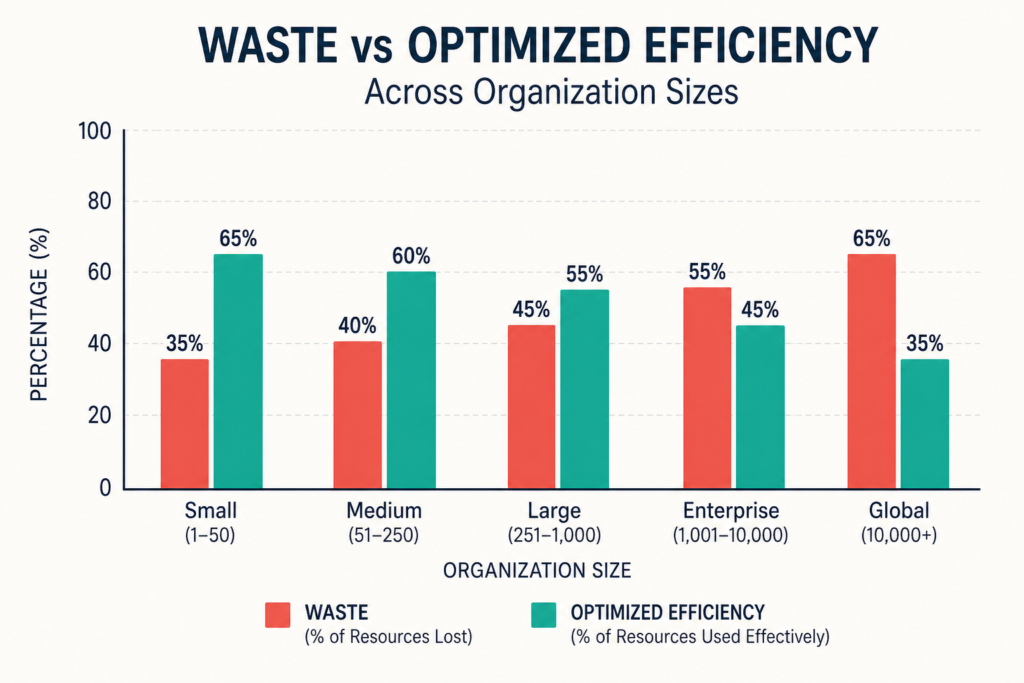
Waste remains a major drain across cloud environments. Surveys show organizations waste between 25% and 35% of their cloud budget on unused, idle, or misconfigured resources ([datastackhub.com](https://www.datastackhub.com/insights/cloud-cost-statistics/?utm_source=openai)). For example, over half of enterprises believe more than 25% of their public cloud spend yields no business value citeturn0news13.
What efficiency gains are top-performing organizations achieving?
The AWS Cost Efficiency score—combining rightsizing, idle cleanup, Savings Plans, and Reserved Instances—shows a median of 83 and mean of 79 as of May 2026 ([aws.amazon.com](https://aws.amazon.com/blogs/aws-cloud-financial-management/the-aws-state-of-cost-efficiency-report/?utm_source=openai)). Larger enterprises also display more consistent efficiency, with narrower performance spreads compared to smaller organizations ([aws.amazon.com](https://aws.amazon.com/blogs/aws-cloud-financial-management/the-aws-state-of-cost-efficiency-report/?utm_source=openai)).
How much can structured cost optimization save?
Enterprises implementing formal cost optimization programs report 25–30% reductions in monthly cloud spend ([datastackhub.com](https://www.datastackhub.com/insights/cloud-cost-statistics/?utm_source=openai)). Automated cost governance tools promise up to 20% annual savings through real-time right-sizing and de-provisioning ([datastackhub.com](https://www.datastackhub.com/insights/cloud-cost-statistics/?utm_source=openai)).
What do FinOps and cloud governance adoption look like?
FinOps adoption continues rising—up 46% in 2025—and now 70% of large enterprises maintain dedicated FinOps or cloud economics teams ([datastackhub.com](https://www.datastackhub.com/insights/cloud-cost-statistics/?utm_source=openai)). Organizations using FinOps frameworks are 2.5× more likely to hit ROI targets and can reduce cloud waste up to 40% in early adopter scenarios ([datastackhub.com](https://www.datastackhub.com/insights/cloud-cost-statistics/?utm_source=openai)). The scope of FinOps has also expanded: 90% now manage SaaS, 98% include AI spend, and many now oversee licensing, private cloud, and data center cost concerns ([data.finops.org](https://data.finops.org/?utm_source=openai)).
What does Total Cost of Ownership (TCO) look like?
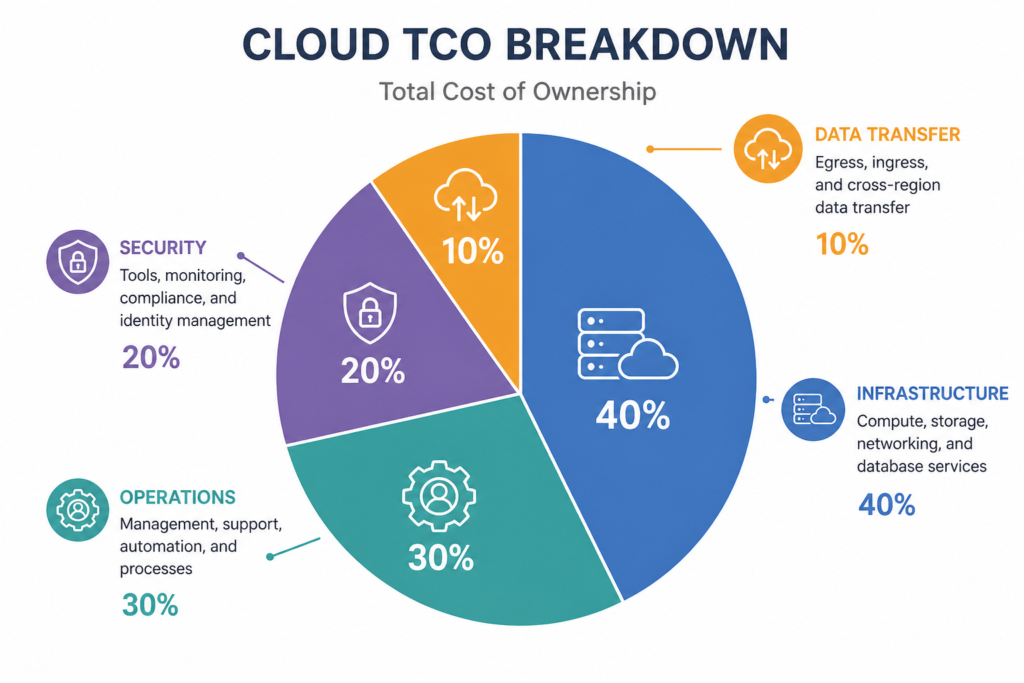
Cloud TCO is projected to shrink by 18–22% by 2026 driven by automation and governance ([datastackhub.com](https://www.datastackhub.com/insights/cloud-tco-total-cost-of-ownership-statistics/?utm_source=openai)). Infrastructure accounts for 45–50% of TCO, operational, governance, and compliance another 25–30%, with security tooling 10–15% and data egress/inter-region traffic adding 5–7% ([datastackhub.com](https://www.datastackhub.com/insights/cloud-tco-total-cost-of-ownership-statistics/?utm_source=openai)).
How do cloud cost benchmarks vary by company size?
| Company Size | Well‑Optimized AWS Spend (Monthly) |
|---|---|
| 10–25 employees | Simple web/app: $300–$1,500; SaaS: $1,000–$4,000; Data‑intensive: $2,000–$8,000 |
| 25–100 employees | Simple web/app: $1,000–$5,000; SaaS: $3,000–$12,000; Data‑intensive: $5,000–$20,000 |
Sources: DataOps Group 2025–2026 data ([dataopsgrp.com](https://dataopsgrp.com/resources/cloud-cost-benchmark?utm_source=openai)). If your AWS spend exceeds these by 50–100%, optimization opportunities are very likely.
How much waste, on average, do organizations see?
Flexera reported an average cloud waste rate of 27% in 2025 ([spendark.com](https://spendark.com/blog/cloud-cost-benchmark-2026/?utm_source=openai)). Well-managed organizations can halve that—achieving 10–15% waste—with basic hygiene like rightsizing, tagging, and Reserved Instances ([spendark.com](https://spendark.com/blog/cloud-cost-benchmark-2026/?utm_source=openai)). Compute often drives the majority—up to 35%—of wastage ([spendark.com](https://spendark.com/blog/cloud-cost-benchmark-2026/?utm_source=openai)).
Why is this data crucial for cost-conscious teams?
Aligning budgets to benchmarks helps operationalize cost control. Knowing median efficiency scores, TCO splits, waste percentages, and company-size spend bands gives engineering, DevOps, and FinOps leaders clear targets and context to act.
How does this article link to our broader cost optimization resources?
For strategic guidance on reducing your cloud spend, see our pillar page Cloud Cost Optimization Guide.
Frequently Asked Questions
- What is the average cloud spend globally in 2026? Forecasts place public cloud spending at over $840 billion in 2026, up from ~$723 billion in 2025.
- How much of cloud budgets are wasted? Around 25–35% of cloud spend is wasted due to idle resources, misconfiguration, and lack of governance.
- What savings can FinOps deliver? Structured FinOps and automation can cut cloud waste by up to 40%, and reduce monthly spend by 25–30%.
- What are good AWS spend benchmarks by company size? Well-optimized AWS monthly spend for a company of 10–25 employees ranges from $300 to $8,000 depending on workload type.
- How is Total Cost of Ownership distributed? Roughly 45–50% compute and storage, 25–30% ops/governance/compliance, 10–15% security/tooling, and 5–7% data transfer.
- What efficiency score is average on AWS? The median Cost Efficiency score is 83, indicating strong optimization relative to peers.
About the Author
Nhon Dang is a cloud infrastructure and operations professional with over 10 years of hands-on experience in cloud services, infrastructure, and business operations. His expertise spans the design, deployment, and operation of cloud platforms and managed services, including virtual machines (VMs), Kubernetes (K8s), object storage (S3), managed databases, Apache Kafka, and cloud GPU infrastructure. Throughout his career, Nhon has worked closely with cloud infrastructure and service operations, gaining practical experience in building reliable, scalable, and cost-efficient cloud environments. His work combines technical expertise with business and operational insight, giving him a practical perspective on how cloud technologies perform in real-world production environments. Nhon writes about cloud infrastructure, Kubernetes, DevOps, distributed systems, cloud computing, infrastructure operations, and cloud service management, sharing insights based on hands-on experience rather than purely theoretical knowledge. His goal is to provide practical, technically accurate, and experience-driven guidance that helps engineers, technical teams, and businesses make better decisions when adopting and operating cloud technologies.