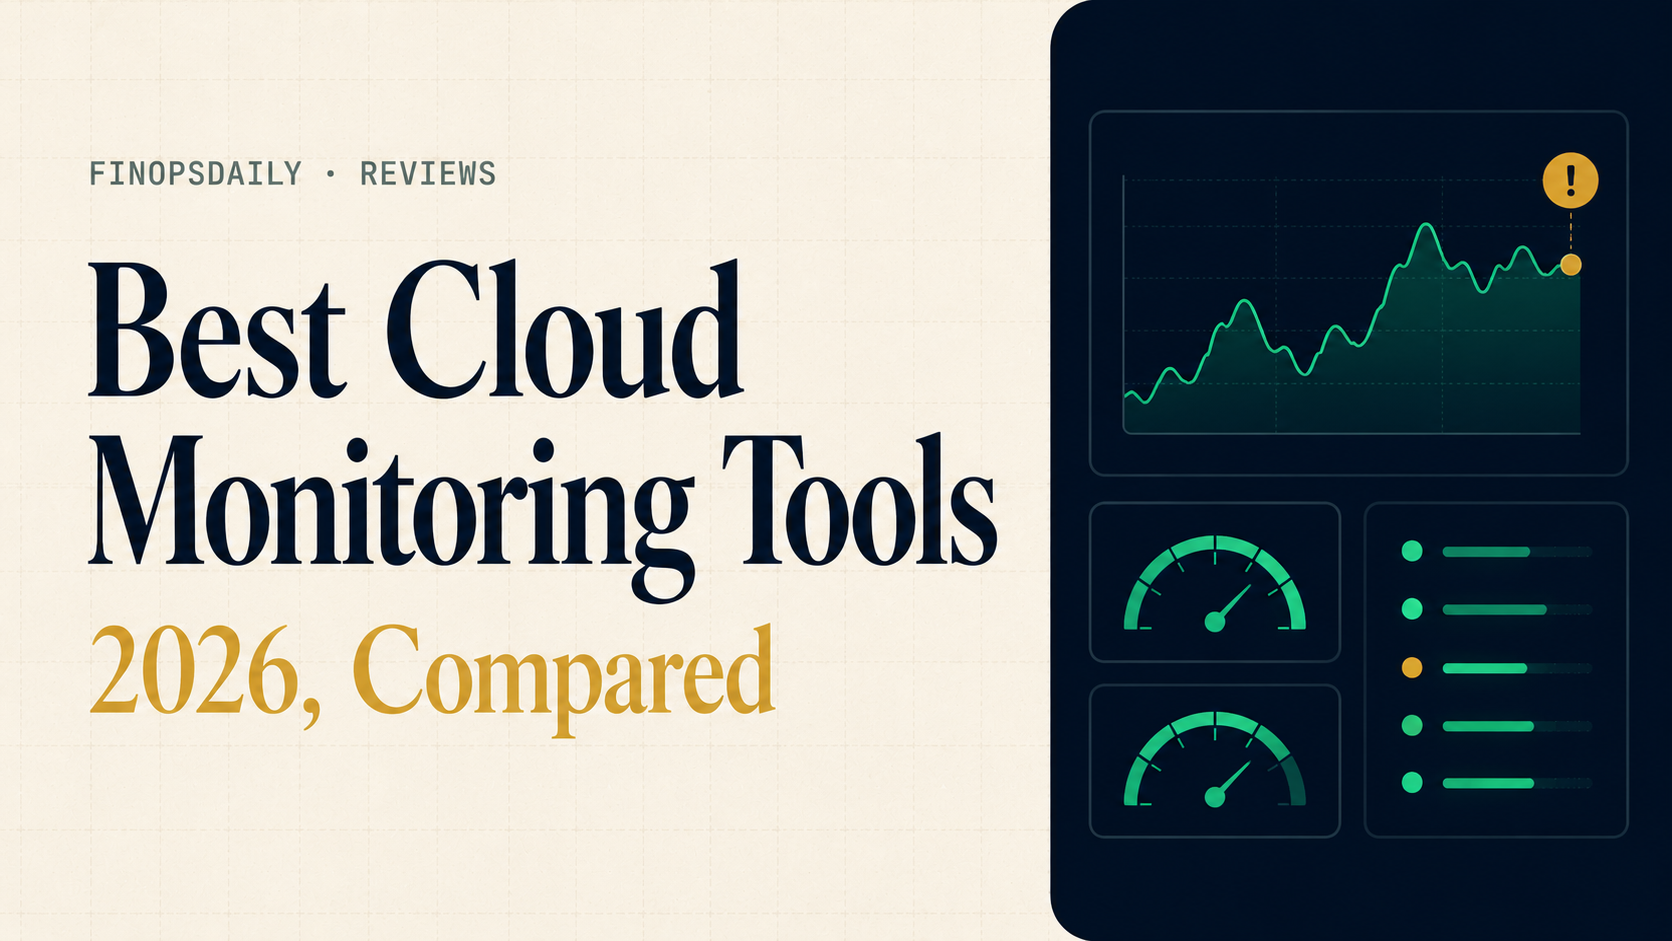
The best cloud monitoring tools in 2026 are Datadog (broadest all-in-one platform), New Relic and Dynatrace (full-stack observability), Grafana with Prometheus (open-source standard), Amazon CloudWatch (native AWS), and cost-focused alternatives like Grafana Cloud or usage-priced platforms for teams whose bills have outgrown per-host pricing. The right choice depends on your stack, scale, and how predictable you need your monitoring bill to be.
This guide compares the leading options and, just as importantly, shows how to keep monitoring spend under control — because observability has quietly become one of the biggest SaaS line items. For the cost angle specifically, see how to reduce your Datadog bill and our SaaS cost management guide.
Key takeaways
- There’s no single “best” — pick by stack, scale, and pricing model.
- Per-host pricing (Datadog, New Relic) is simple but can balloon with containers and add-ons.
- Open-source (Prometheus + Grafana) is cheapest on license but costs engineering time.
- Monitoring is now a major cost center — choose a tool whose pricing model matches how you scale.
What to look for in a cloud monitoring tool
Before comparing names, weigh these criteria:
- Coverage — metrics, logs, traces (APM), real-user monitoring, synthetics. Do you want one platform or best-of-breed?
- Pricing model — per host, per GB, per user, or usage-based. This determines how your bill scales (see observability vs monitoring for scope).
- Scalability — does it handle containers and ephemeral infrastructure without punishing you on host count?
- Ease of setup vs control — managed SaaS is fast to start; open-source gives control but needs engineering effort.
- Cost predictability — can you forecast the bill, or does it spike with usage?
The best cloud monitoring tools compared
Datadog — the broadest all-in-one
The most feature-complete platform: infrastructure, APM, logs, RUM, synthetics, security, and more in one place. The trade-off is cost and complexity — it bills per host and per GB across many independent meters, so spend compounds. Best for teams that want everything in one platform and will actively manage the bill. See Datadog pricing explained, how to reduce your Datadog bill, and Datadog alternatives.
New Relic — consumption-based full-stack
A strong all-in-one with a usage-based model (data ingested + users) that some teams find more predictable than per-host pricing. Good for full-stack observability across apps and infrastructure.
Dynatrace — enterprise, AI-driven
Heavy on automation and AI-assisted root-cause analysis, aimed at large enterprises with complex environments. Powerful, with enterprise pricing to match.
Grafana + Prometheus — the open-source standard
Prometheus for metrics collection and Grafana for dashboards is the de facto open-source stack, especially in Kubernetes. No license cost, but you run and scale it yourself (or use managed Grafana Cloud). Best for teams with engineering capacity that want control and low licensing cost.
Amazon CloudWatch — native AWS
Built into AWS, convenient for AWS-centric teams, with no extra tool to deploy. Less suited to multi-cloud or deep APM, and its own costs (custom metrics, logs, dashboards) can creep up. See CloudWatch alternatives if you outgrow it.
Cost-focused and usage-priced alternatives
A wave of newer platforms compete specifically on predictable, volume-based pricing rather than per-host billing — attractive to teams whose Datadog or New Relic bills have outgrown their value. Evaluate these when cost predictability is your top concern.
Container and Kubernetes monitoring
Containerized environments have their own considerations (per-container costs, short-lived workloads). See best container monitoring tools for that focus.
How to choose
A quick way to narrow it down:
- AWS-only, simple needs → start with CloudWatch.
- Kubernetes-heavy, engineering capacity → Prometheus + Grafana (or Grafana Cloud).
- Want one platform for everything, can manage cost → Datadog or New Relic.
- Large enterprise, complex environment, want automation → Dynatrace or Datadog.
- Bill has outgrown per-host pricing → a usage-priced alternative.
Controlling your monitoring bill
Whatever you choose, observability spend behaves like a usage-based SaaS cost and needs governing. The universal levers:
- Index/retain only what you query — ingest broadly, but don’t pay to make every log searchable.
- Control custom metric cardinality — high-cardinality tags multiply cost fast.
- Right-size hosts and exclude ephemeral ones — don’t pay full price for five-minute containers.
- Commit to your baseline — annual commitments beat on-demand; commit to baseline, not peak.
- Own and allocate the spend — tie monitoring cost to the teams that generate it.
The tactical playbook for the most common case is in how to reduce your Datadog bill, and the broader discipline is SaaS cost management. To manage monitoring spend alongside the rest of your cloud bill, see best FinOps tools.
Frequently asked questions
What are the best cloud monitoring tools?
Datadog (broadest all-in-one), New Relic and Dynatrace (full-stack observability), Grafana with Prometheus (open-source standard), and Amazon CloudWatch (native AWS), plus usage-priced alternatives for cost-sensitive teams.
What is the difference between monitoring and observability?
Monitoring tracks predefined metrics and alerts you when something is wrong; observability lets you explore and explain why using metrics, logs, and traces together. See observability vs monitoring.
What is the cheapest cloud monitoring tool?
Open-source Prometheus + Grafana has no license cost, but you pay in engineering time to run it. Among managed tools, usage-priced platforms are often cheaper at scale than per-host options.
Why are cloud monitoring tools so expensive?
Most bill per host and per GB across several independent meters (logs, metrics, traces), so costs compound as you add products and data. Containers and high-cardinality metrics accelerate this.
How do I reduce my monitoring costs?
Index only the logs you query, cap custom metric cardinality, exclude ephemeral hosts, commit annually to your baseline, and assign an owner to the bill. See how to reduce your Datadog bill.
Written by the FinOpsDaily team. Last updated: 2026. We assess tools on capability and pricing model; pricing changes often, so verify current rates before deciding.